Operations leaders who manage in-house maintenance teams track technician utilization. Jobs completed per day. Time on site. Callback rate. These are real numbers that reflect something real about how in-house staff is performing.
Operations leaders managing large distributed portfolios, especially vendor-heavy ones, should be tracking other metrics.
Here’s how to think about both metrics, when each matters most, and what large portfolio operators actually track to get a complete picture of maintenance performance.
The difference that actually matters at scale
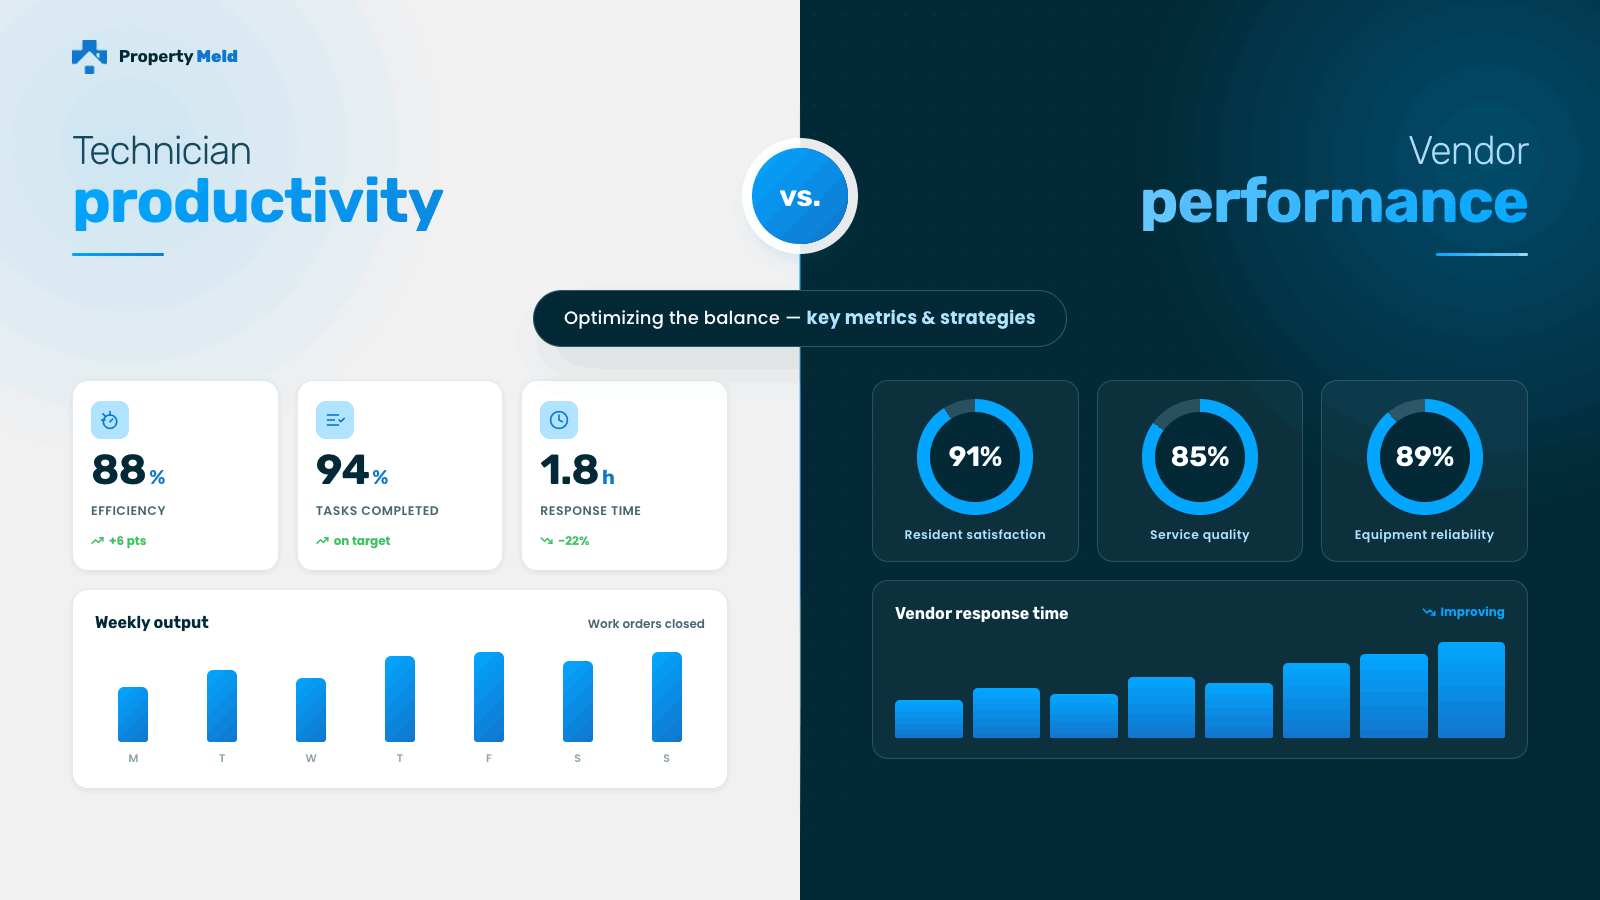
Technician productivity is an internal metric. It measures how efficiently maintenance staff is working in terms of output, capacity, and workload distribution. It’s essential for operators with in-house teams and drives real decisions around hiring, scheduling, and performance management.
Vendor performance is a network metric. It measures how reliably an external vendor network is delivering on completion time, first-time fix rate, resident satisfaction, and communication quality. For portfolios running a vendor-heavy model, this is where most of the performance variance actually lives.
| Technician productivity metrics | Vendor performance metrics |
| Work orders completed per tech per day | Assigned to schedule speed |
| Average time on site per job type | Average completion time by vendor and category |
| Callback / repeat visit rate by tech | First-time fix rate by vendor |
| Labor hours per unit per month | Communication responsiveness from dispatch to confirmation |
| Workload distribution across team | Vendor reliability score across portfolio |
| Overtime utilization | Cost per completed request by vendor |
Why vendor performance is undertracked at large portfolios
In large portfolios, particularly in single-family rental, often run 60 to 80% of their maintenance volume through external vendors. If primary performance tracking is built only for internal techs, it’s looking at a minority of maintenance activity and calling it the performance picture.
The result is a visibility gap that shows up in specific ways:
- Average time-to-complete is visible at the portfolio level but can’t be broken down by dispatch lag vs. vendor execution vs. parts availability
- Certain vendors may seem slower or less reliable but the data doesn’t exist to quantify it in a way that’s defensible for vendor network decisions
- Resident satisfaction varies significantly by market but gets attributed to regional differences rather than vendor performance variance
- When a vendor relationship deteriorates, the signal comes through a resident complaint rather than a performance alert
The hybrid reality: most large portfolios run both
This isn’t an either/or situation. Most large property management companies run a hybrid model with in-house technicians handling routine, high-volume categories and an external vendor network for specialty work, overflow, and geographically dispersed properties.
In a hybrid model, both measurement systems need to work. The mistake most operators make isn’t ignoring one completely. It’s only having dashboards built for one.
For in-house teams, track:
- Work orders completed per technician per day, segmented by job category
- Callback rate, specifically requests that require a second visit within 30 days
- Technician utilization to surface whether top performers are maxed out while others are underloaded
- Average time from assignment to completion vs. estimated time
- Resident satisfaction scores tied specifically to in-house technician visits
For vendor networks, track:
- Resident satisfaction scores per vendor, categorized by repair categories
- First-time fix rate by vendor and by job category
- Assigned to scheduled time, or how long before a vendor acknowledges and schedules
- Portfolio-wide vendor performance comparison to enable data-driven network decisions
The visibility question that separates good from great
Here’s a practical test. If a COO asked why resident satisfaction in the Atlanta portfolio is 12 points lower than Dallas, how long would it take to answer that with data worth trusting?
If the answer is a few days and a spreadsheet, visibility is lagging. If the answer is that the vendor performance breakdown by category can be pulled up in two minutes, the operation is running the way large portfolios need to.
The difference isn’t more data. It’s data that’s organized around the questions operations leaders actually need to answer in real time, across the whole portfolio, without manual reconciliation.
| Property Meld’s Oversight and Data tools provide both sides of this picture. Technician performance and vendor accountability in a single dashboard built for portfolio-scale operations. |