Pick a question. Any question.
What’s the average time-to-complete in the Southeast portfolio? What’s the first-time fix rate by vendor this quarter? Which property has the highest maintenance cost per unit and why?
For most operations leaders managing thousands of doors, the answer to all three is the same: give me a few hours and I’ll pull it together.
That’s not a data problem. The data exists. It’s sitting in a property management system right now. The problem is that it’s not organized, not comparable, and not available in a form that’s actually usable for running an operation. That’s a visibility problem, and it has a specific cause.
How the data gets fragmented
Maintenance data in most large portfolios lives across at least three or four systems. The PMS handles request intake and closure. Vendor communication happens across email, text, and phone. Coordinator notes live in whatever format each person prefers. And somewhere there’s a spreadsheet that someone built six months ago and hasn’t been updated since.
Every one of those systems captures part of the picture. None of them captures the whole thing. Because the data formats don’t match, comparison is almost impossible without manual reconciliation.
Add regional variation on top of that. Different property managers categorize requests differently. Different coordinators use different priority conventions. Portfolio-level data becomes a collection of local datasets that happen to live in the same system. Not an operational truth. A patchwork.
| Data fragmentation isn’t a technical failure. It’s what happens when maintenance volume grows faster than the systems designed to manage it. |
The hidden cost of living in spreadsheets
Most operators who rely on spreadsheets don’t experience it as a problem. It works. The data exists. It just takes time to pull together.
Here’s what that time actually costs:
- Every hour an operations leader spends reconciling reports is an hour not spent on the operational decisions those reports are supposed to inform
- Decisions made on stale data are decisions made without visibility into what changed in the last two weeks
- When ownership asks a question and the answer takes two days, the implicit message is that the operation isn’t under control, even when it is
- Spreadsheet-built reports don’t update on their own, which means every new question requires a new export, a new reconciliation, and a new version of the same file
The real cost isn’t the time. It’s the operational decisions that get made slower, less confidently, or not at all because the data infrastructure isn’t there to support them.
What unanswerable questions reveal
There’s a specific set of questions that expose a visibility gap. If any of these require a spreadsheet, the gap is real:
- “Which vendor is performing worst on HVAC in the Dallas market?” If this can’t be answered in two minutes, the vendor network isn’t being managed. It’s being hoped at.
- “Why did average completion time go up last month?” If the cause can’t be isolated to a specific vendor, property type, or category, the problem can’t be fixed.
- “What’s maintenance satisfaction in the properties up for renewal?” If this can’t be pulled proactively, the leading indicator that predicts renewal risk is being ignored.
- “How does maintenance cost per unit compare across markets?” If this requires a multi-system export, budget season will always be a defensive exercise.
The difference between a reporting tool and a visibility platform
A reporting tool lets operators pull reports. Run the query, get the output, interpret the results. It’s reactive. Operators have to know what they’re looking for and go find it.
A visibility platform surfaces what matters without waiting to be asked. Vendor performance declining before it affects CSAT. A property drifting from the portfolio’s average completion time. A coordinator managing 40% more volume than the rest of the team.
At scale, that distinction matters. No operations leader can check every metric every day. The system needs to flag where attention is needed, not wait for someone to go looking.
What fixing it actually requires
Getting out of the spreadsheet cycle doesn’t require a data team or a BI implementation. It requires a maintenance platform built with portfolio-level visibility as a design principle, not a reporting add-on.
That means:
- Consistent data across every property in the portfolio, with the same categories, definitions, and fields, so comparison is actually valid
- Real-time dashboards that update as requests move through the system, not batch reports that run at midnight
- Performance views organized around the questions operations leaders actually ask, broken down by vendor, property, region, and category
- Alerts that surface anomalies before they become problems, so analysis is proactive rather than forensic
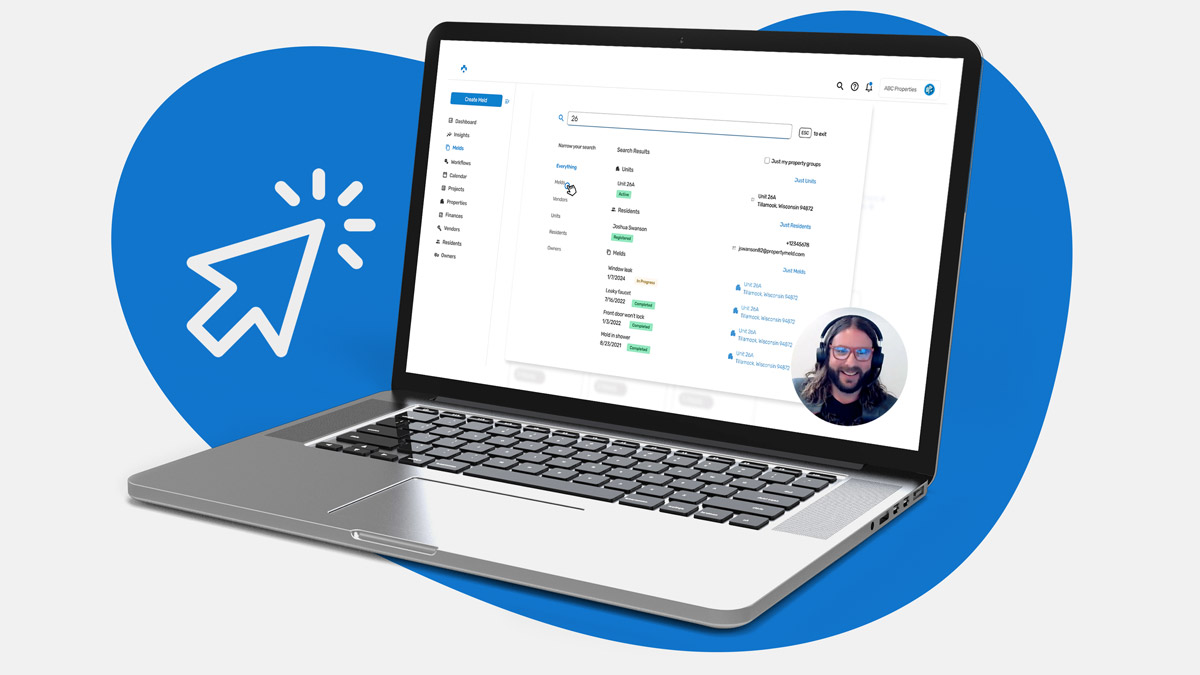
Property Meld’s Insight tools are built around exactly this principle. The goal isn’t a better reporting interface on top of the same fragmented data. It’s a single system where maintenance data is consistent, current, and organized around how operations leaders actually need to use it.
| The benchmark for what’s possible: any question about maintenance performance should be answerable in under two minutes without opening a spreadsheet. If it isn’t, the gap is worth closing. |