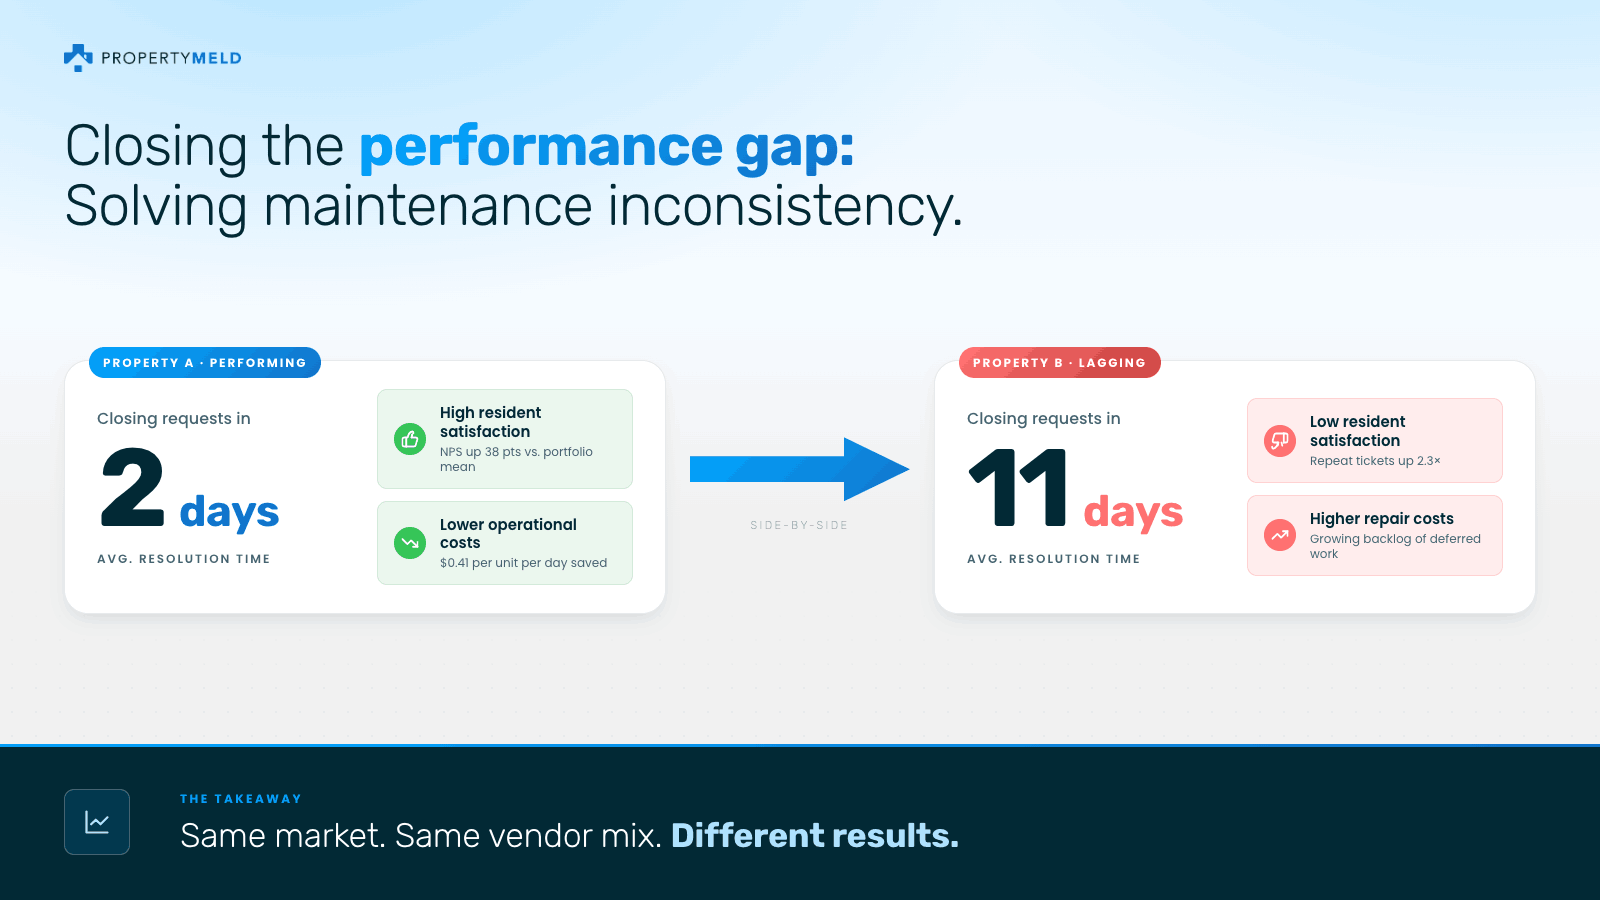
Here’s a number that should bother every operations leader managing a large portfolio: the performance gap between the best and worst properties.
Not the worst property’s performance in isolation. That’s fixable. The gap itself is what reveals whether an organization is running a system or a collection of individual operations that happen to share the same brand.
Most operators know this gap exists. Very few have actually measured it. And fewer still have a plan to close it.
What variance looks like in practice
Variance in maintenance performance shows up in a few specific ways at large portfolios:
- Completion time spread: A portfolio average might be 4 days. But broken down by property, the range runs from 1 day to 14 days. The average masks a wide distribution, and residents living in the 14-day properties are having a fundamentally different experience than those in the 1-day properties.
- First-time fix rate by location: One region closes 78% of requests on the first visit. Another closes 51%. Both use the same vendor categories. The difference lives in how requests get diagnosed, triaged, and dispatched.
- Resident satisfaction variance: Portfolio-level CSAT might look acceptable. Drill down by property and a 30-point spread appears between the highest and lowest performers, wide enough to produce meaningfully different renewal rates.
- Cost per request by market: Some markets run 60% higher cost per maintenance request than others. Not because the work is more expensive, but because of inefficiency in vendor selection, repeat visits, or poor scheduling.
Why variance is harder to fix than underperformance
When one property is clearly underperforming, the intervention is obvious. Investigate, identify the cause, and fix it. The problem is localized.
Variance is harder because it’s systemic. It means the maintenance process doesn’t reliably produce consistent behavior across the portfolio. The outcome of a maintenance request depends on which property a resident happens to live in, not on the quality of the operation as a whole.
The causes of variance are usually one of three things:
Process inconsistency
Different coordinators, regional managers, or on-site teams running different versions of the same maintenance process. Request prioritization that varies by who’s handling it. Dispatch criteria that live in people’s heads rather than in a system.
Vendor network inconsistency
Vendor selection decisions made at the local level without portfolio-level performance data. One region’s preferred HVAC vendor has a 65% first-time fix rate. Another region’s preferred vendor has a 40% first-time fix rate. Nobody’s comparing those numbers across markets.
Communication inconsistency
Residents at some properties get proactive updates throughout the maintenance process. Residents at others hear nothing until the job is done, or until they call to check in. The maintenance work might be identical. The resident experience isn’t.
The cost of letting variance persist
Variance isn’t just an operational inefficiency. It’s a financial one.
| Source of variance | Financial impact |
| Wide completion time spread | Resident experience inconsistency drives variable renewal rates by property |
| First-time fix rate gaps | Hidden labor cost in repeat visits, often 30 to 40% more expensive than a single resolved visit |
| Vendor cost inconsistency | Material cost differences for the same work category across markets, undetected without data |
| Communication inconsistency | Higher inbound call volume from residents without status visibility, draining coordinator capacity |
| Undetected underperformers | Deferred maintenance risk builds over time at low-visibility properties |
Operators who close the variance gap don’t necessarily improve their average performance dramatically. They improve their floor. The worst outcomes get better, the distribution tightens, and the resident experience becomes predictable regardless of which property a resident lives in.
How to identify where variance is coming from
Before the gap can be closed, it has to be visible. That requires maintenance data that’s consistent enough across the portfolio to actually compare.
Start with three comparisons:
- Completion time by property, segmented by category. HVAC completion time in one market vs. another reveals whether it’s a vendor problem, a dispatch problem, or a parts availability problem.
- First-time fix rate by vendor across markets. If the top vendor in one region is performing significantly better than the top vendor in another, the problem is vendor selection, not regional character.
- Resident satisfaction by property, correlated to response time. This correlation is almost always strong. The properties with the widest completion time variance are almost always the properties with the lowest satisfaction scores.
Once variance is visible and its source is isolated, the intervention becomes obvious. The gap between knowing and not knowing is the gap between managing an operation and being managed by it.
Closing the gap: what actually works
Variance reduction isn’t about pushing every property to perform like the best performer overnight. It’s about building the conditions that make consistent performance the default.
- Standardize the process, not just the judgment. Define the criteria for prioritization and dispatch at the portfolio level so coordinators are applying the same logic regardless of property or market.
- Make vendor performance data visible across regions so local vendor selection decisions are informed by portfolio-wide comparisons, not just local relationships.
- Build resident communication into the system rather than into individual coordinator habits. Status updates that run automatically produce consistent resident experience regardless of who’s handling the request.
- Set property-level benchmarks and track drift. Properties slipping below portfolio norms should surface automatically, not through a quarterly review.
Property Meld’s platform is built to make all of this possible with consistent data, real-time variance visibility, and the operational standardization tools that let operations leaders close the gap at scale.
| The goal isn’t perfection at every property. It’s a tight enough distribution that the worst property is still delivering an experience residents will renew for. |