Large property management companies generate an enormous amount of maintenance data. Every request submitted, every dispatch sent, every completion recorded adds to a growing dataset that, in theory, should tell operations leaders everything they need to know about how maintenance is performing.
In practice, most of that data is sitting in systems that don’t track it accurately or make it nearly impossible to use.
This is the maintenance visibility problem at scale. Not a data problem. A structural problem with how that data is collected, organized, and surfaced. Most operations leaders are working around it rather than through it.
The data that exists vs. the data that’s usable
Here’s what most large portfolios actually have:
- A property management system that logs maintenance requests, assignments, and closures allows for customization or manual entry, leading to data inconsistencies and human error
- Coordinator notes and context that live in individual inboxes and memories rather than in a shared, searchable system
- Resident satisfaction data collected sporadically through surveys that may or may not be tied to specific maintenance interactions
- Financial data from maintenance spend that lives in the accounting system and doesn’t connect automatically to operational performance data
Each of those data sources tells part of the story. None of them tells the whole story. Getting to the whole story requires manually pulling from each source, reconciling differences in format and definition, and assembling an answer that was already out of date by the time the question was asked.
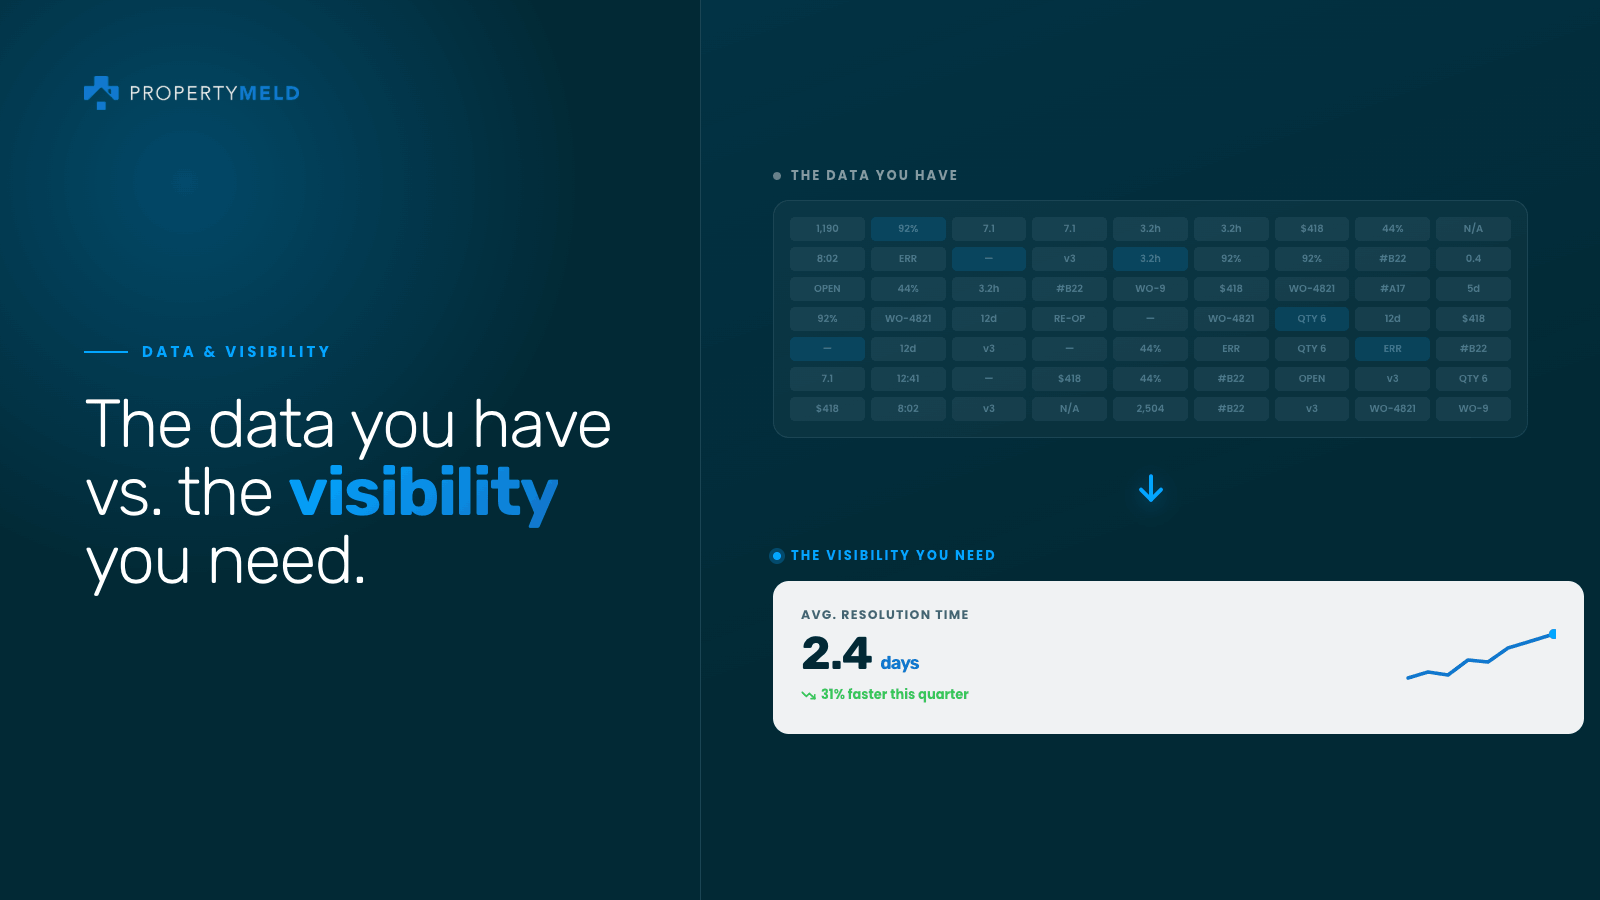
| The visibility problem isn’t that data doesn’t exist. It’s that the data that exists isn’t organized to answer the questions that actually matter to operations leaders. |
The questions that expose the gap
The fastest way to assess a portfolio’s maintenance visibility is to try to answer a few operational questions in real time. The ones that require more than a few minutes to answer reveal where the gap is:
- Which technician has the lowest first-time fix rate on HVAC requests this quarter? If this requires a data export and manual calculation, individual performance isn’t being managed. It’s being observed after the fact.
- Which coordinator currently has the highest active request volume? If this requires checking in with regional managers rather than pulling up a dashboard, workload distribution isn’t visible enough to manage proactively.
- What’s the maintenance satisfaction score for properties with renewals coming up in the next 60 days? If this can’t be pulled in under five minutes, the leading indicator most connected to renewal outcomes isn’t being monitored.
- Which properties have drifted more than 20% above the portfolio average completion time in the last 30 days? If this isn’t surfacing automatically, variance is accumulating invisibly.
Why the gap persists
The maintenance visibility gap persists at large portfolios for three structural reasons:
Data lives in too many places
When operational data is distributed across a PMS, coordinator notes, and a financial system, aggregating it requires manual effort. That manual effort happens periodically rather than continuously, which means visibility is always a snapshot from the last time someone assembled it.
Systems were built for transactions, not operations
Property management systems are built to record what happened: a request was submitted, assigned, completed, closed. They’re not built to surface what those transactions mean operationally: whether the pattern of completions reflects a technician performance gap, a coordinator capacity constraint, or a property-level issue that’s compounding.
The transaction record is necessary. The operational interpretation of that record is what’s missing.
Reporting is structured around the system rather than the question
Most PMS maintenance reporting lets operators run the reports the system was designed to produce. Additionally, these systems allow for tons of customization. What this means is when reports are pulled, it is extremely difficult to identify meaningful trends, because everything is entered differently. Custom exports require time, technical access, and knowledge of what to pull. For most operations leaders, that means the question doesn’t get answered as quickly as it needs to.
What genuine visibility changes
Operations leaders who describe the shift to genuine maintenance visibility consistently point to the same change: they stop being surprised by problems and start catching them early.
A technician whose performance is declining in a specific category shows up in the dashboard before it shows up in a resident complaint. A coordinator whose workload is unsustainable surfaces before the backlog builds. A property drifting from portfolio norms triggers a flag before the variance compounds into a significant gap.
That shift from reactive to proactive changes the nature of the conversations operations leaders have with ownership and asset management. Instead of explaining why something went wrong, they’re presenting data on what they caught early and how they addressed it.
The practical requirements for real visibility
- Consistent data definitions across every property in the portfolio so that a first-time fix rate in one market means exactly the same thing as a first-time fix rate in another
- Real-time data access rather than periodic reports so that the information driving decisions reflects what’s happening now rather than what was happening last month
- Portfolio-level aggregation built into the system rather than assembled manually so that comparing performance across properties is a dashboard view rather than a data project
- Anomaly surfacing that flags when a metric moves outside expected ranges rather than requiring someone to check every metric manually every day
These requirements describe a maintenance platform that was designed around operational visibility as a core function.
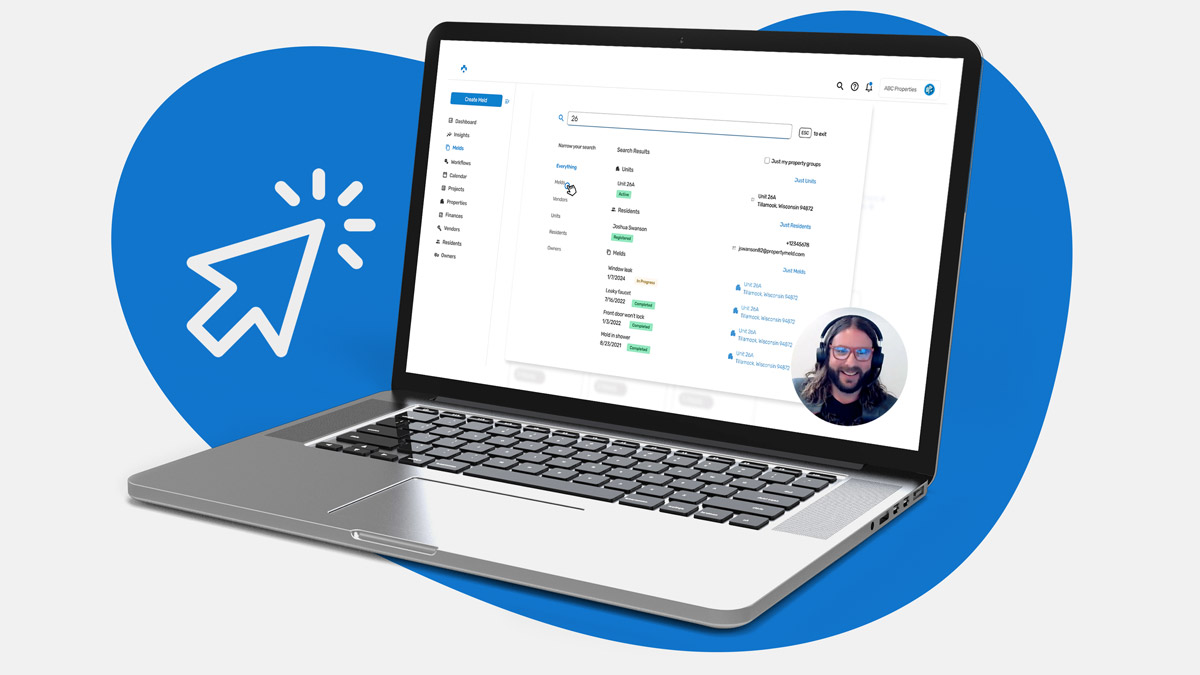
| Property Meld’s Oversight and Data tools are built to turn maintenance transaction data into operational knowledge. Real-time dashboards. Portfolio-wide performance comparison. Individual technician performance by category. |