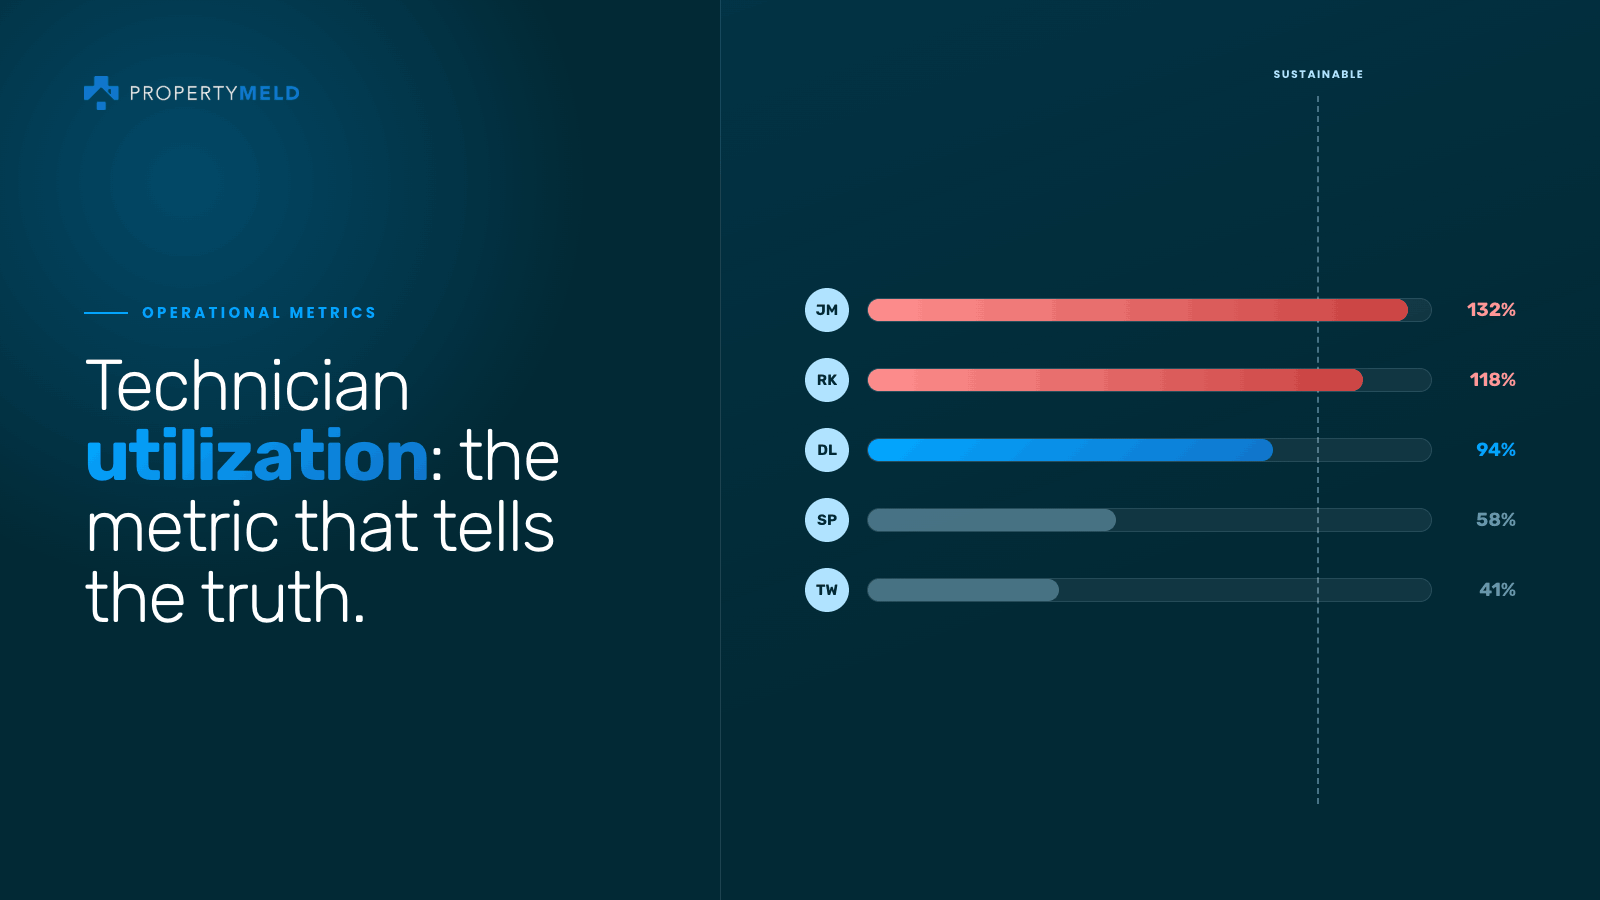
There’s a version of maintenance underperformance that doesn’t show up in completion time averages. It shows up when two technicians complete 5 jobs per day, and the others complete 2.5. It shows up in the skilled HVAC technician spending a third of the day on appliance repairs because the dispatch queue doesn’t account for specialization. It shows up in a property that consistently lags the portfolio average even though headcount looks fine on paper.
These are utilization problems. And at large portfolios with in-house maintenance staff, they’re more common and more costly than most operations leaders realize.
Utilization is the measurement of whether maintenance capacity is being deployed effectively relative to demand. Not just whether the work is getting done, but whether the right people are doing the right work at the right time with a workload they can actually sustain. It measures the amount of billable hours a technician works in comparison to their total hours logged.
Most large portfolios track completion. Very few track utilization. The gap between those two things is where avoidable cost and avoidable underperformance accumulate quietly.
What poor utilization actually looks like
Poor technician utilization at large portfolios is rarely dramatic. It hides in plain sight inside metrics that look acceptable at the portfolio level.
- Workload imbalance across coordinators and technicians: One coordinator manages 80 active requests. Another manages 30. One technician runs 12 jobs a day. Another runs 5. The portfolio average looks fine. The overloaded coordinator is one family emergency away from a backlog that affects residents for a week. The overloaded technician is burning out.
- Geographic dispatch inefficiency: A technician drives 45 minutes to a property, completes one job, and drives back. A different technician was 10 minutes from that same property but was routed elsewhere. The work gets done. The labor cost is significantly higher than it needed to be. Residents waited longer than they had to.
- Skill-category mismatch: A certified HVAC technician spends a third of their time on appliance repairs because dispatch doesn’t account for specialization. Cost per repair is higher than it should be. First-time fix rate on HVAC requests suffers because the right person isn’t doing the right job consistently.
- After-hours concentration: Emergency and on-call coverage clusters among a small subset of the team. Burnout builds in that group while others carry lighter after-hours loads. Response quality declines as fatigue accumulates. No one catches it because after-hours performance isn’t tracked separately from daytime operations.
- Scheduling gaps that generate avoidable repeat requests: Technicians are available but the scheduling system doesn’t surface same-day appointment windows to residents. Residents accept a window two days out. The request ages unnecessarily. Completion time averages rise without any shortage of actual capacity.
| Utilization problems are invisible in outcome metrics until they’ve accumulated long enough to cause visible failures. By then, they’ve been expensive for months. |
The difference between tracking completion and tracking utilization
Completion tracking answers the question: did the work get done? Utilization tracking answers the question: was the team deployed well enough to get the work done efficiently, consistently, and without burning people out?
Those are different questions. Completion tracking is necessary. Utilization tracking is what makes completion tracking improvable.
Without utilization data, operations leaders are making staffing and scheduling decisions based on lagging signals. A technician shows signs of burnout after months of overloading. A property starts missing windows after weeks of geographic dispatch inefficiency. A coordinator’s error rate rises after a sustained period of caseload imbalance. By the time these signals are visible in outcome metrics, the underlying utilization problem has been accumulating for a while.
With utilization data, those same problems surface as leading indicators. Workload imbalance is visible before it becomes a backlog. Dispatch inefficiency shows up in drive time per request before it shows up in completion time. Skill-category mismatch appears in first-time fix rate by technician before it shows up in resident satisfaction.
The five utilization metrics worth tracking
1. Active caseload by coordinator
The number of open, in-progress requests assigned to each coordinator at any given time. This should be visible in real time rather than assembled at the end of the day. Coordinators who are consistently running 50% higher caseloads than their peers are either more efficient or more overloaded. Either condition warrants attention.
2. Jobs completed per technician per day, segmented by category
Aggregate productivity numbers hide as much as they reveal. A technician completing 8 jobs a day across three different categories may be running at full capacity. A technician completing 8 jobs a day in a single category may have significant headroom. Segmenting by category surfaces whether the productivity picture is driven by volume or by specialization efficiency.
3. Drive time per request by technician
Total daily drive time divided by completed requests. This metric exposes geographic dispatch inefficiency more directly than any other. Technicians with high drive time per request are either covering too large a territory or being routed inefficiently. Both are correctable with better dispatch logic.
4. First-time fix rate by technician, segmented by category
A technician’s first-time fix rate in their primary category versus their rate in categories outside their specialization reveals skill-category mismatch directly. A technician who resolves 85% of HVAC requests on the first visit but only 55% of plumbing requests is being used below their potential when assigned to plumbing.
5. After-hours request distribution across on-call staff
How many after-hours requests each on-call technician handled over the last 30, 60, and 90 days. Concentration among a small group is both a fairness issue and a reliability risk. Distributed after-hours coverage is more sustainable and produces more consistent emergency response.
| These five metrics don’t require a new data collection process. They require a maintenance platform that structures existing data in a way that surfaces them without manual assembly. |
Why utilization is hard to track without the right system
Utilization data exists in most maintenance operations. It just isn’t organized in a way that makes it usable.
Coordinator caseload is visible in the request queue if the queue is structured around individual assignment. Technician productivity data is in dispatch records. Drive time data exists in scheduling logs. First-time fix rate by technician requires tagging both the technician and the outcome at the request level.
The aggregation problem is that none of these data points live in the same view. Building a utilization picture manually requires pulling from multiple places, reconciling formats, and producing a snapshot that’s already stale by the time it’s assembled.
The result is that most operations leaders manage technician utilization through supervisor observation rather than data. A regional manager notices that one technician seems stretched. These signals get acted on when they become noticeable, which is after they’ve been affecting performance for a while.
The business case for tracking utilization
| Utilization improvement | Financial impact |
| Balanced coordinator caseload | Reduced request backlog, lower error rate, reduced coordinator turnover risk |
| Optimized dispatch geography | Reduced drive time per request, lower labor cost per completion, faster response windows for residents |
| Skill-category alignment in dispatch | Higher first-time fix rate in specialized categories, lower repeat request rate, reduced total labor per resolved issue |
| Distributed after-hours coverage | Consistent emergency response quality, reduced burnout-related turnover, lower liability exposure |
| Real-time caseload visibility | Proactive rebalancing before backlogs form, reduced escalations, lower inbound call volume from residents |
The connection to resident experience
Technician utilization has a resident-facing cost that often goes untracked alongside the operational cost.
When coordinators are overloaded, resident communication slows. When scheduling gaps exist that the system doesn’t surface, residents wait longer than available capacity would require. When skill-category mismatch produces repeat requests, the same resident interacts with maintenance multiple times for the same issue.
Residents don’t experience these as utilization problems. They experience them as maintenance being slow, unreliable, or unable to get something fixed properly. That experience directly affects whether they renew.
The utilization improvement and the resident satisfaction improvement are the same operational change. Tracking them together rather than in separate reporting silos is what makes the full business case visible.
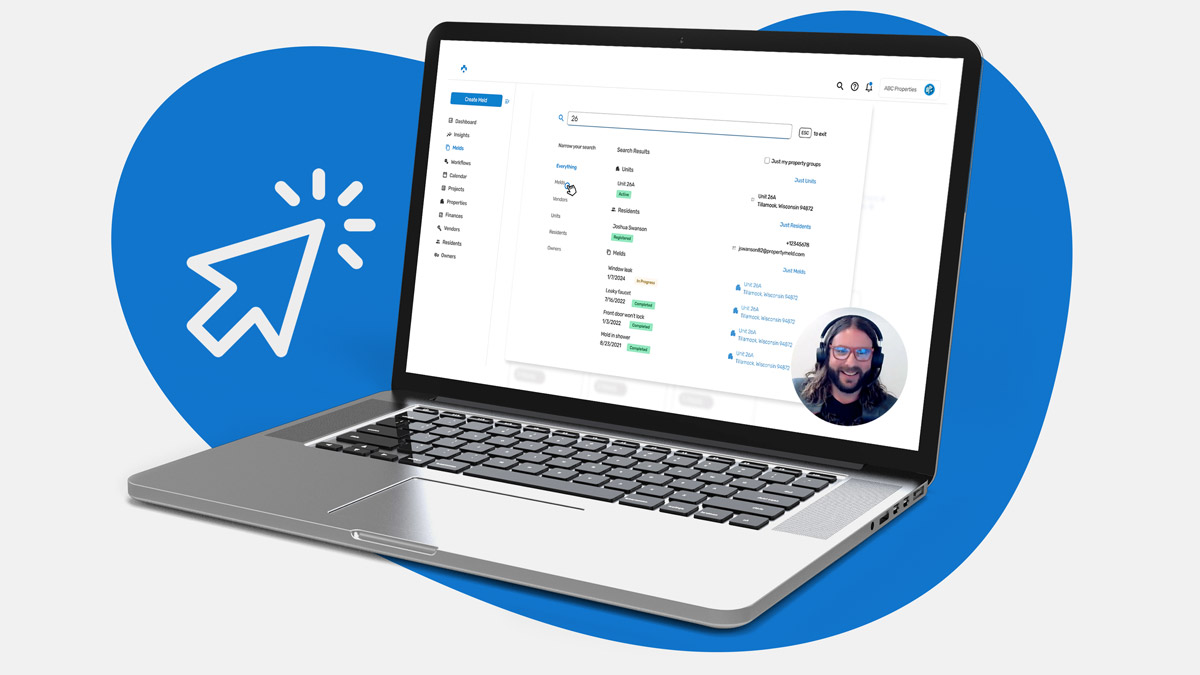
| Property Meld surfaces coordinator caseload, technician productivity by category, and first-time fix rate by technician in real time. Utilization problems that previously surfaced through coordinator burnout or resident complaints surface through the dashboard instead. |