Most property management companies don’t set out to build a reactive maintenance operation. They start small, develop habits that work at the time, and grow. The habits scale. The underlying process doesn’t.
For large enterprise companies, the gap between a maintenance operation that was built to scale and one that simply grew shows up everywhere. In the coordinator managing 40% more volume than anyone else on the team. In the technician whose dispatch queue doesn’t account for specialization. In the resident who submitted a maintenance request two weeks ago and still doesn’t know what’s happening.
None of those problems require more staff to solve. They require a better system.
This guide is for operations leaders who are ready to stop managing maintenance by exception and start running it as a discipline. We’ll cover what good looks like at scale, what the operational inputs are that drive business outcomes, and what separates portfolios that run maintenance well from those that are perpetually behind it.
The core idea: maintenance is a systems problem
The single most important shift in how large portfolios think about maintenance is moving from a staffing frame to a systems frame.
The staffing frame says: maintenance is slow because there aren’t enough technicians or coordinators. The fix is more people.
The systems frame says: maintenance is slow because the process produces inconsistent outcomes regardless of headcount. The fix is a better process with better visibility into how it’s performing.
This distinction matters because it changes where the intervention happens. In a staffing frame, every maintenance problem is a hiring problem. In a systems frame, the first question is always: where is the process breaking down, and does the operation have the visibility to see it?
Large portfolios that run maintenance well have almost universally made this shift. They track operational inputs, not just outputs. They manage variance, not just averages. They connect maintenance performance to business outcomes rather than treating it as an isolated cost center.
| Maintenance isn’t a staffing problem. It’s a systems problem. And systems problems have systems solutions. |
The three operational layers that determine performance
Maintenance performance at scale breaks down into three distinct layers. Each has its own metrics, its own failure modes, and its own connection to business outcomes.
Layer 1: The operational inputs
These are the variables that determine whether a maintenance request gets resolved well. How requests are triaged. How technicians are utilized. How communication flows between coordinators, field staff, and residents.
The most important operational input at large portfolios with in-house teams is technician utilization. Not just whether work is getting done, but whether the right people are doing the right work at the right time. A portfolio where two technicians run 12 jobs a day while three others run 5 isn’t a headcount problem. It’s a dispatch and assignment problem. The capacity is there. The system isn’t using it well.
Utilization visibility is what makes the difference. Operations leaders who can see workload distribution in real time make different decisions than those who find out about imbalances at the end of the week.
Layer 2: The visibility layer
The visibility layer is where operational data becomes operational knowledge. It’s the difference between knowing that average time-to-complete is 4.2 days and knowing that the 4.2-day average masks a range from 1 day to 14 days depending on which property a resident lives in.
Most large portfolios have data. Very few have visibility. The data lives across a property management system, coordinator notes, and a spreadsheet someone built last year. Getting a clear picture requires manual assembly, which means decisions are made on information that’s already out of date.
Real visibility means problems surface before they compound. A technician whose performance is declining in a specific category shows up in a dashboard before it shows up in resident complaints. A property drifting from portfolio norms triggers a flag before the variance becomes a business problem.
Layer 3: The business outcomes
Maintenance connects directly to the metrics that ownership and asset management care about most: resident satisfaction, renewal rates, and NOI.
The connection between maintenance performance and resident renewals is among the most consistent findings in property management research. Maintenance experience ranks alongside rent price and location as a top driver of renewal decisions. Operations leaders who can draw a direct line from maintenance operational inputs through resident satisfaction to renewal rate and retained revenue are running maintenance as a strategic business function, not a cost center.
What good looks like for large portfolios
Well-run maintenance operations at large portfolios share a handful of characteristics regardless of asset class or portfolio composition.
- Process consistency: The same maintenance request at Property A and Property B moves through the same triage, dispatch, and communication workflow. Outcomes may vary, but the process is standardized. This is what makes performance comparable and improvable.
- Technician utilization visibility: Operations leaders can see who’s doing what, at what volume, with what outcomes, in real time. Overloaded staff gets support before they fall behind. Skill-category mismatches get corrected before they inflate repeat request rates.
- Resident communication that runs without manual intervention: Residents know what’s happening with their maintenance request without calling the office. Status updates flow automatically throughout the request lifecycle. Coordinators manage exceptions rather than status calls.
- Portfolio-level performance data: Maintenance performance is visible across every property in a single view. Variance is detectable. Problems surface before they compound. Decisions get made on current data rather than last month’s report.
- A clear line to business outcomes: Operations leaders can connect maintenance satisfaction scores to renewal rates and translate that connection into financial terms that ownership responds to.
| The gap between a maintenance operation built to scale and one that simply grew is measurable. It shows up in technician capacity, resident satisfaction, and renewal rates. And it’s closeable. |
The most common operational gaps at large portfolios
| Operational gap | What it costs |
| Technician utilization and workload distribution is invisible | Overloaded staff, inconsistent response times, avoidable repeat requests |
| Resident communication is manual | High inbound call volume, coordinator capacity drain, resident frustration from silence |
| Maintenance data requires manual assembly | Decisions made on stale information, slow response to emerging problems |
| Performance varies widely across properties | Inconsistent resident experience, variable renewal rates, ownership questions that take days to answer |
| Maintenance ROI isn’t quantifiable | Budget conversations are defensive, maintenance is positioned as a cost rather than a business lever |
| In-house team process isn’t standardized | Performance depends on which coordinator or technician handles the request rather than on a consistent system |
None of these gaps requires hiring more people to close. Each one is a process and visibility problem with a process and visibility solution.
Where to start
For operations leaders taking stock of where their maintenance program stands, the most useful starting point is a set of questions that expose the gaps directly:
- Can technician workload distribution be seen across the full portfolio in real time, or does that require asking regional managers?
- When a resident submits a maintenance request, do they receive automatic status updates throughout the process without coordinator intervention?
- Can performance be compared across properties in the same dashboard, or does that require a spreadsheet?
- Is there data connecting maintenance satisfaction scores to renewal rates for this portfolio specifically?
- When ownership asks about maintenance costs, is the answer ready in under five minutes, or does it take a day to pull together?
The number of those questions that require more than a few minutes to answer is a reasonable proxy for how much of the maintenance operation is running on instinct versus systems.
How Property Meld fits into this
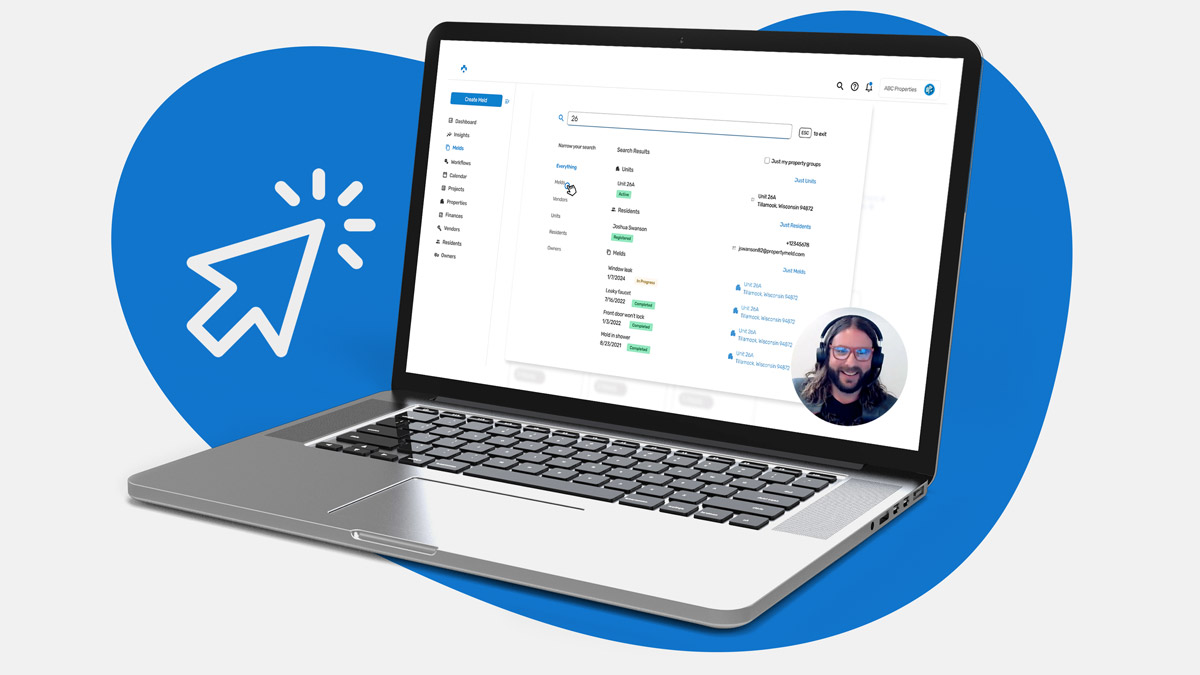
Property Meld is built for property management companies running maintenance as a business discipline rather than a reactive function. The platform covers all three operational layers: the inputs, the visibility, and the business outcome connections.
That means technician utilization tracking that surfaces imbalances in real time. A technician mobile app that guides in-house teams through a standardized workflow and captures the performance data that makes the whole operation improvable. Resident communication that runs automatically. Portfolio-level dashboards that make variance visible and actionable. And the reporting infrastructure that connects maintenance performance to renewal rate and NOI in terms ownership understands.
| Property Meld publishes a monthly benchmark report with industry data on maintenance performance across large portfolios. See where your operation stands. |